


By Hitesh Pandya
Sr. Cloud Architect, AWS Certified Architect (Professional)
![]() Today’s applications are quite complex, encompassing hundreds or thousands of moving parts including containers, microservices, legacy internal services, and third-party services. Amazon CloudWatch Synthetics is a new feature that supports monitoring your REST APIs, URLs, and website content every minute, 24×7, and alerts you when your application endpoints don’t behave as expected.
Today’s applications are quite complex, encompassing hundreds or thousands of moving parts including containers, microservices, legacy internal services, and third-party services. Amazon CloudWatch Synthetics is a new feature that supports monitoring your REST APIs, URLs, and website content every minute, 24×7, and alerts you when your application endpoints don’t behave as expected.
CloudWatch Synthetics enables you to continually verify your customer experience even when there is no customer traffic on your applications. This allows you to discover issues before customers do and proactively resolve them. It is a powerful platform implemented using Lambda functions, which provides a customizable set of templates in NodeJS, leveraging the Puppeteer library to check for page-load errors and load latencies for UI assets, transaction completions, broken or dead links, complex wizard flows, or checkout flows in your applications. You can also use the platform to create alerts in case of application errors.
To reduce the mean time to resolution, CloudWatch Synthetics has multiple debugging artifacts including screenshots (stored in an S3 bucket), HAR (HTTP archive) files, and log files. The platform allows you to isolate alarming application endpoints and map them back to underlying infrastructure issues. It is also possible to use CloudWatch Synthetics to easily monitor both internal and public-facing endpoints. CloudWatch Synthetics lets you integrate endpoint monitoring in your CI/CD pipelines through support for AWS CloudFormation, AWS SDK, and CloudWatch Synthetics APIs.
The following is a quick walkthrough of the Synthetics Console.
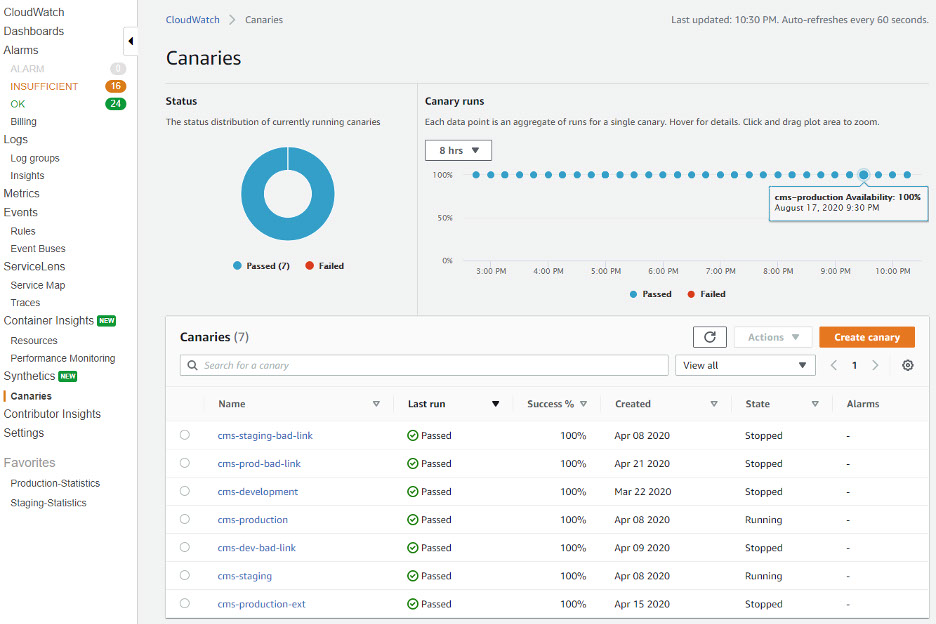
Open the CloudWatch Console and click Canaries to get started. The Canary runs section displays both the status of the Canary Runs that occurred in the last 8 hours (Configurable) and the data points. Each data point is an aggregation of runs for a single canary.
To view details of the runs for any particular canary, e.g. the cms-production canary, click on the canary name.
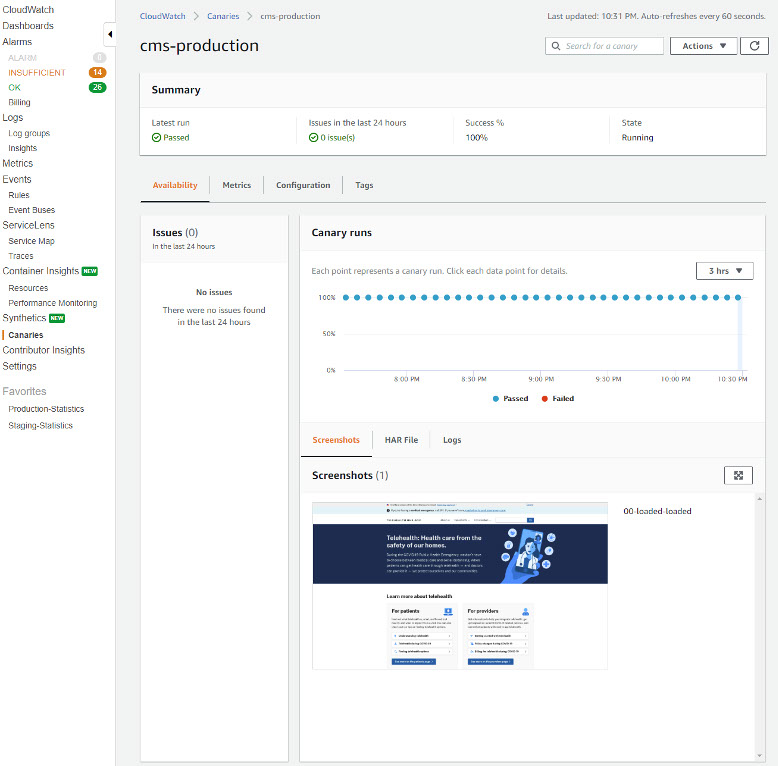
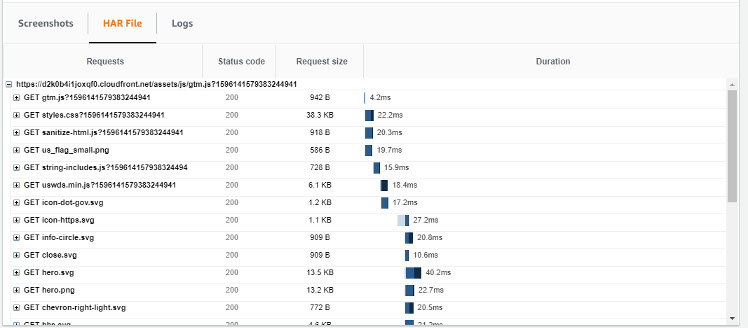
As can be seen in the Canary runs section, all the runs have passed. Further details of the canary run, such as the screenshots that were captured as part of each run, along with the HAR files and logs, can be viewed on the details section. Each HAR file contains a detailed log of the HTTP requests that were made when the canary was run, along with the responses and the amount of time that it took for the request to complete.
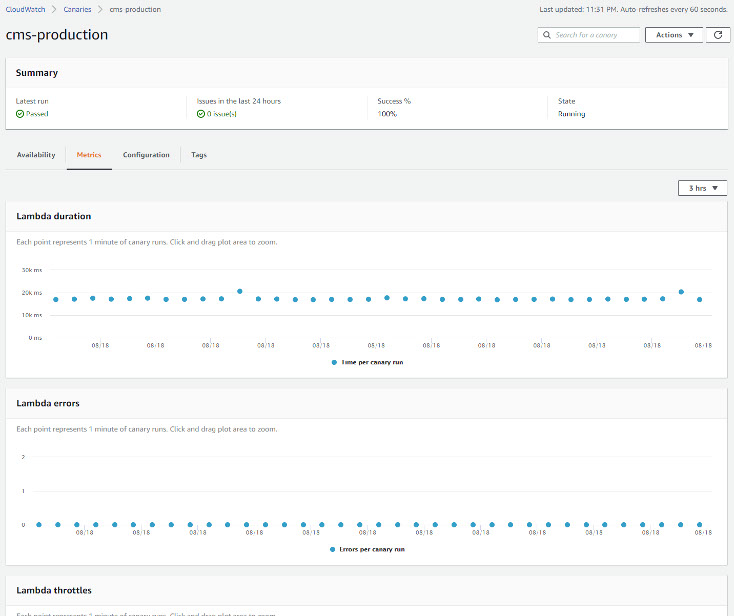
Because canaries are implemented using a Lambda function, the function’s execution metrics in can be viewed in the Metrics tab.
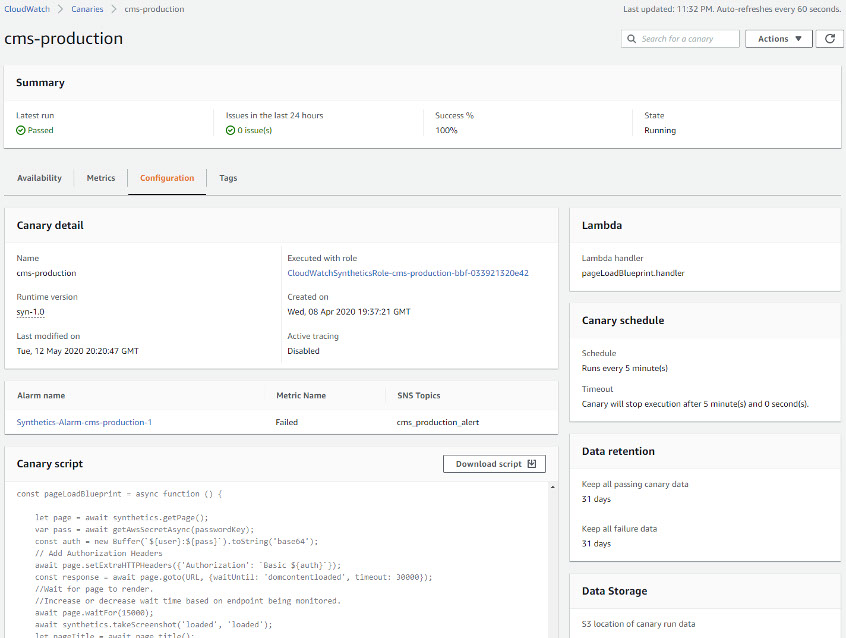
The canary script and other details can be viewed in the Configuration tab.
Creating a Canary
On a recent project, the ECS team used CloudWatch Synthetics on an important website for Heartbeat Monitoring and as a Broken Link Checker. The website was being generated using markdown, which made it critical to ensure the links on the generated pages were always valid.
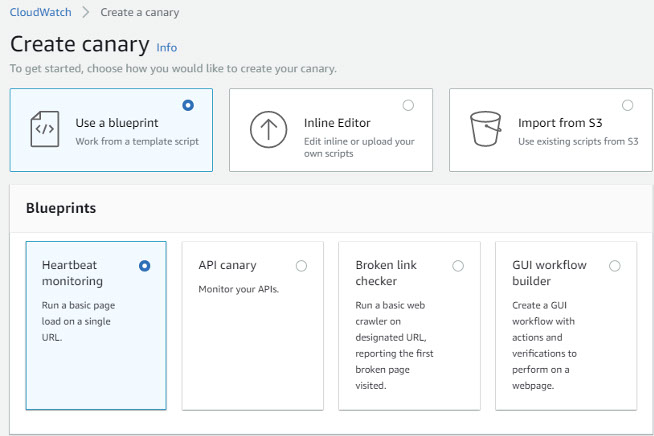
The process for creating a canary is quite intuitive. It is simply matter of clicking the Create canary button on the CloudWatch Synthetics console and following the prompts. It is possible to use one of four blueprints to create the canary, or to upload or import an existing one.
All of these methods ultimately result in a script that is run either once or periodically.
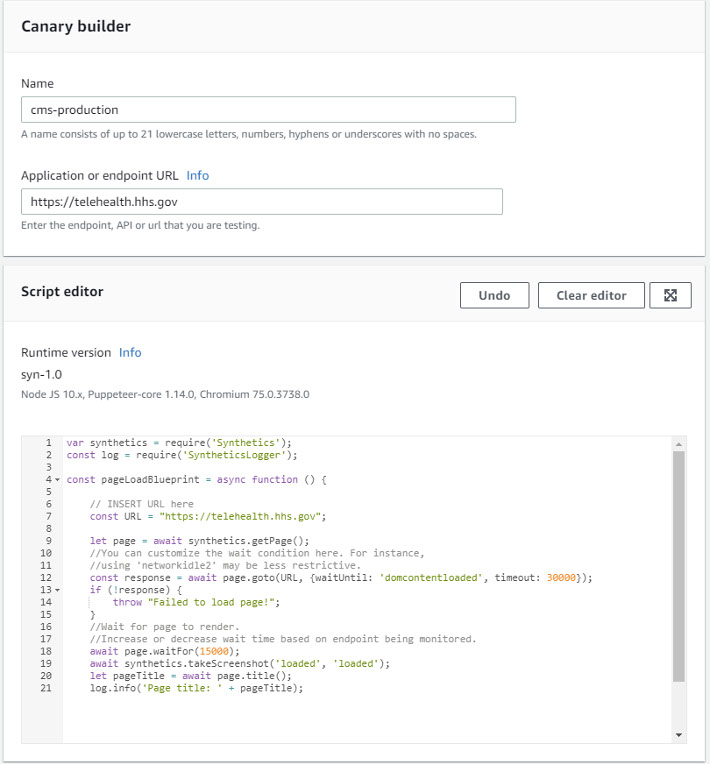
The cms-production canary shown above was built from the Heartbeat Monitoring blueprint, like this:
The script is populated with the correct values and can be further customized if desired.
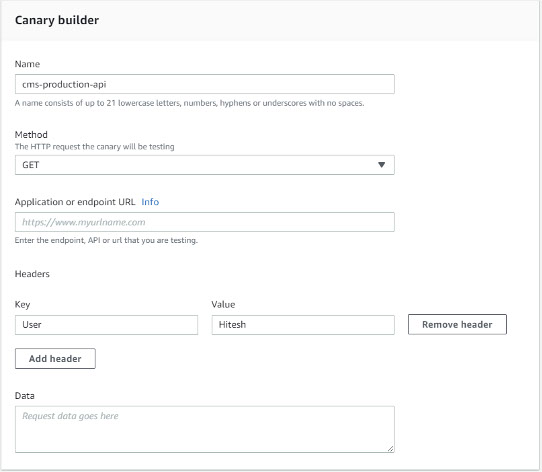
It is also possible to create canaries for API endpoints using either GET or PUT methods, any desired HTTP headers, and some request data. An example of a GET is depicted here:
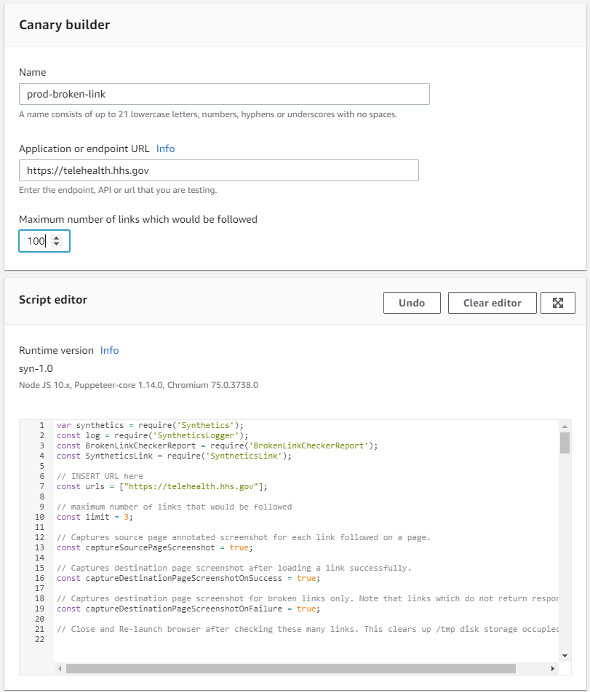
The third type of template provided is the Broken Link Checker:
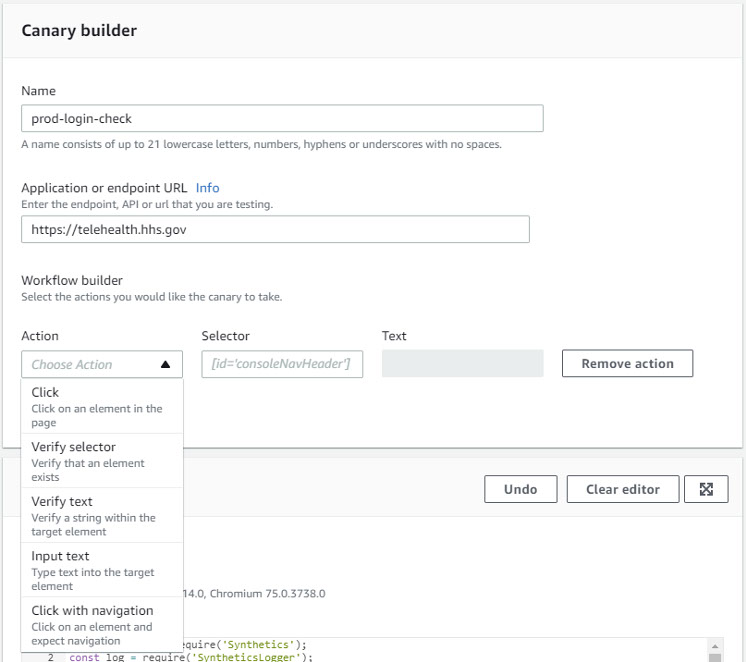
The final template is a GUI workflow builder that facilitates the creation of a sophisticated canary that can include simulated clicks, content verification via CSS selector or text, text entry, and navigation to other URLs:
Scripts signal success by running to completion and errors by raising an exception.
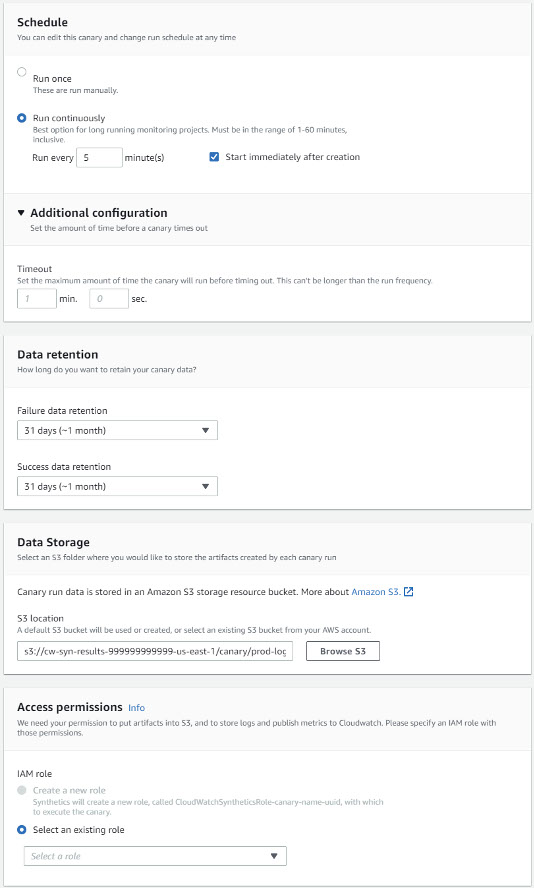
Additionally, it is possible to establish a schedule and data retention periods. A S3 bucket must be specified for storing the artifacts created each time a canary is run. An IAM role must be specified under which the canary will execute. Any additional required permissions can be configured by modifying the policies applied:
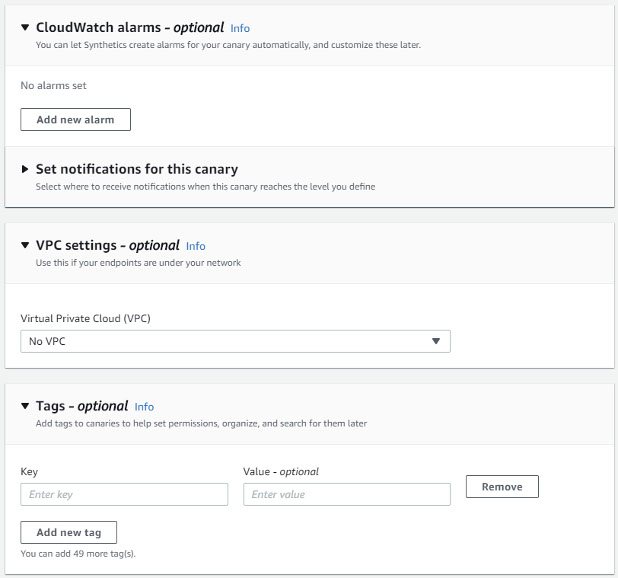
Optionally, CloudWatch Alarms can be set and access to endpoints in a VPC and Tags can be specified:
Additional points to consider:
- Authentication posed a potential issue. As a best practice, credentials should never be hardcoded. The best approach, therefore, is to leverage AWS Secrets Manager.
- Ensure the least possible permissions are specified on the IAM Role used by the Synthetics service.
- CloudWatch Synthetics can be used in conjunction with ServiceLens and AWS X-Rayto map issues back to the proper part of the monitored application.
- Canaries can be created using the Console, CLI (aws synthetics), APIs (CreateCanary, DescribeCanaries, and more), and from CloudFormation templates (AWS::Synthetics::Canary).
Costs – The AWS Free Tier allows 100 canary runs per month at no charge. After that, you pay per run, with prices starting at $0.0012 per run, plus the usual charges for S3 storage and Lambda invocations.
Limits – You can create up to 100 canaries per account in the US East (Northern Virginia), Europe (Ireland), US West (Oregon), US East (Ohio) Asia Pacific (Hong Kong), Middle East (Bahrain), Africa (Cape Town), Europe (Milan) regions, and Asia Pacific (Tokyo) regions, and up to 20 per account in other regions where CloudWatch Synthetics are available.